There are throughout the year a lot of fine days because it is located between a Cyugoku mountainous district and the Shikoku mountainous district, and it doesn't receive the influence of the snow cloud and the rain cloud easily, and in Hiroshima City, durations of sunshine of year are 2000 hours or more and very comfortable conditions of location. Moreover, it faces the wave Inland Sea, and a clement climate is rich. The highest recorded temperature was 38.7 °C on July 17, 1994, while the lowest recorded temperature was 8.6 °C on December 28, 1917.
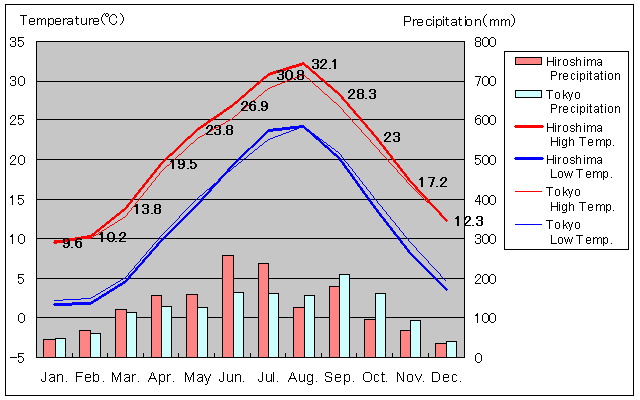
Hiroshima Temperature and Precipitation Graph
Japan Map(Google Map)
Now, Map data loading ..... (If the map is not displayed, There is a possibility to be able to display by permitting JavaScript.)
Hiroshima, Hiroshima Prefecture (広島県広島市) Temperature & Precipitation Monthly Averages
Temperature scale: degree Celsius (°C)
Month
Jan
Feb
Mar
Apr
May
Jun
Jul
Aug
Sep
Oct
Nov
Dec
Average High Temperature (°C)
9.6
10.2
13.8
19.5
23.8
26.9
30.8
32.1
28.3
23
17.2
12.3
Average Low Temperature (°C)
1.7
1.8
4.5
9.8
14.3
19.2
23.7
24.3
20.2
13.8
8.2
3.5
Average Precipitation (mm)
46.9
66.9
120.5
156
156.8
258.1
236.3
126
180.3
95.4
67.8
34.8
Hiroshima's Year Average Temperature 16.4 °C, Year Average High Temperature 20.6 °C, Year Average Low Temperature 12.1 °C, The average annual rainfall 1545.8 mm
Temperature scale: degree Fahrenheit (°F)
Month
Jan
Feb
Mar
Apr
May
Jun
Jul
Aug
Sep
Oct
Nov
Dec
Average High Temperature (°F)
49.3
50.4
56.8
67.1
74.8
80.4
87.4
89.8
82.9
73.4
63.0
54.1
Average Low Temperature (°F)
35.1
35.2
40.1
49.6
57.7
66.6
74.7
75.7
68.4
56.8
46.8
38.3
Average Precipitation (inches)
1.85
2.63
4.74
6.14
6.17
10.16
9.30
4.96
7.10
3.76
2.67
1.37
Hiroshima's Year Average Temperature 61.4 °F, Year Average High Temperature 69.1 °F, Year Average Low Temperature 53.8 °F, The average annual rainfall 60.9 inches
Tokyo (東京) Temperature & Precipitation Monthly Averages
Month
Jan
Feb
Mar
Apr
May
Jun
Jul
Aug
Sep
Oct
Nov
Dec
Average High Temperature (°C)
9.8
10
12.9
18.4
22.7
25.2
29
30.8
26.8
21.6
16.7
12.3
Average Low Temperature (°C)
2.1
2.4
5.1
10.5
15.1
18.9
22.5
24.2
20.7
15
9.5
4.6
Average Precipitation (mm)
48.6
60.2
114.5
130.3
128
164.9
161.5
155.1
208.5
163.1
92.5
39.6
Rainy Days
4.6
5.8
9.5
10.1
9.6
11.9
10.4
8.2
11.3
9.1
6.2
3.8
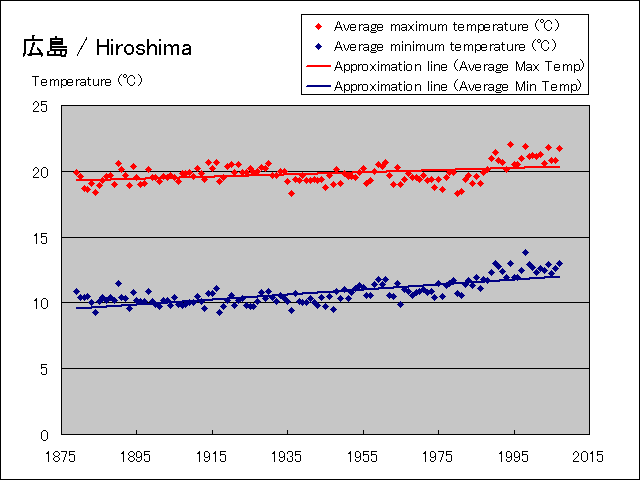
Rising graph of mean maximum temperature and mean minimum temperature of Hiroshima by global warming.(Data from 1879 to 2007)
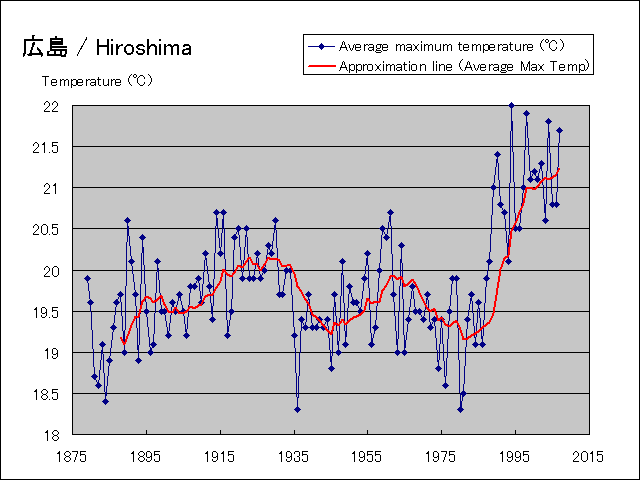
Detailed change graph of mean maximum temperature of Hiroshima.(It is moving average data for ten years from 1879 to 2007.)
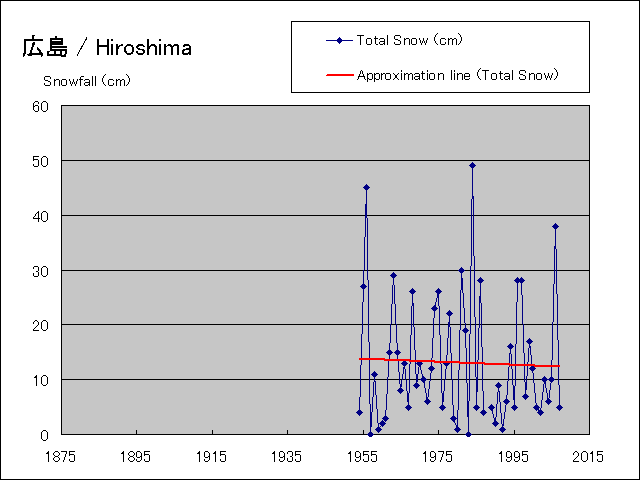
Change graph of snowfall during year of Hiroshima(Data from 1954 to 2007)
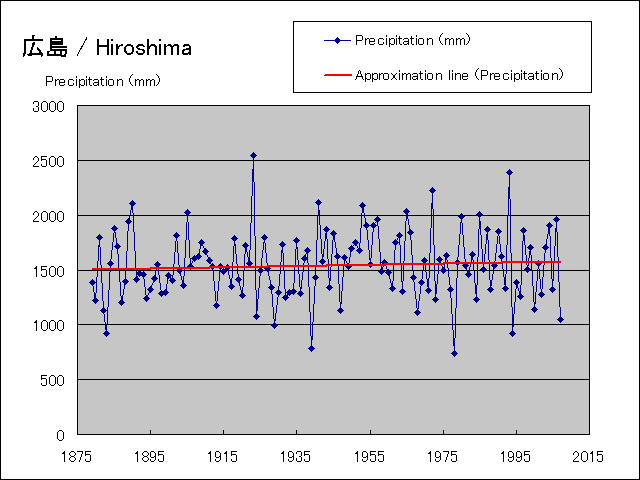
Change graph of annual rainfall of Hiroshima(Data from 1879 to 2007)