As for the climate of Sapporo, the temperature difference between summer and winter is great because of the amalgamation climate of the sub frigid zone moist climate and the Sea of Japan side climate. Samsamusa day and night is violent. Winter is less than Otaru City and Ishikari City in the vicinity because it is not exposed directly to the west wind from the sea though are a lot of snowfalls. There is no rainy season, and the influence of the typhoon is also a little in summer. A large-scale river is not flooded since the Ishikari river of 1981 is flooded. The snowfall that remains in the mountainous district until about summer plays the role of storing water, and the water resource is abundant. The highest recorded temperature was 36.2 °C on August 7, 1994, while the lowest recorded temperature was -28.5 °C on February 1, 1929.
Sapporo Temperature and Precipitation Graph
Japan Map(Google Map)
Now, Map data loading ..... (If the map is not displayed, There is a possibility to be able to display by permitting JavaScript.)
Sapporo, Hokkaido (北海道札幌市) Temperature & Precipitation Monthly Averages
Temperature scale: degree Celsius (°C)
Month
Jan
Feb
Mar
Apr
May
Jun
Jul
Aug
Sep
Oct
Nov
Dec
Average High Temperature (°C)
-0.9
-0.3
3.5
11.1
17
21.1
25
26.1
22
15.8
8.1
2.1
Average Low Temperature (°C)
-7.7
-7.2
-3.5
2.7
7.8
12.4
17.1
18.5
13.6
6.9
0.9
-4.4
Average Precipitation (mm)
110.7
95.7
80.1
60.9
55.1
51.4
67.2
137.3
137.6
124.1
102.7
104.8
Rainy Days
17.9
15.6
13.9
9.2
8.6
6.7
7.5
8.8
10
12.4
13.7
15.7
Sapporo's Year Average Temperature 8.7 °C, Year Average High Temperature 12.6 °C, Year Average Low Temperature 4.8 °C, The average annual rainfall 1127.6 mm
Sapporo's Year Average Temperature 47.6 °F, Year Average High Temperature 54.6 °F, Year Average Low Temperature 40.6 °F, The average annual rainfall 44.4 inches
Tokyo (東京) Temperature & Precipitation Monthly Averages
Month
Jan
Feb
Mar
Apr
May
Jun
Jul
Aug
Sep
Oct
Nov
Dec
Average High Temperature (°C)
9.8
10
12.9
18.4
22.7
25.2
29
30.8
26.8
21.6
16.7
12.3
Average Low Temperature (°C)
2.1
2.4
5.1
10.5
15.1
18.9
22.5
24.2
20.7
15
9.5
4.6
Average Precipitation (mm)
48.6
60.2
114.5
130.3
128
164.9
161.5
155.1
208.5
163.1
92.5
39.6
Rainy Days
4.6
5.8
9.5
10.1
9.6
11.9
10.4
8.2
11.3
9.1
6.2
3.8
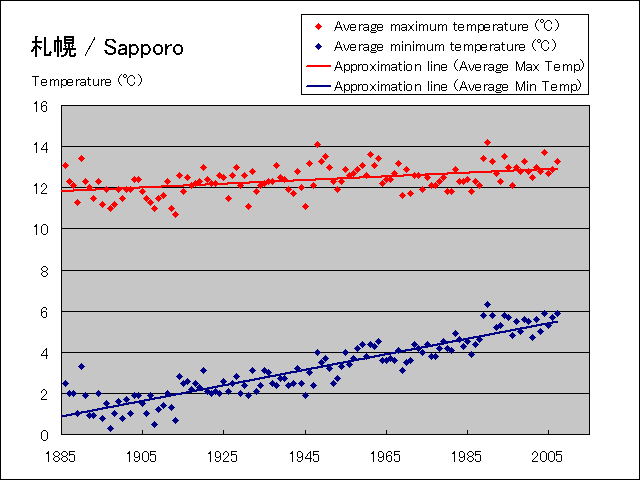
Rising graph of mean maximum temperature and mean minimum temperature of Sapporo by global warming.(Data from 1886 to 2007)
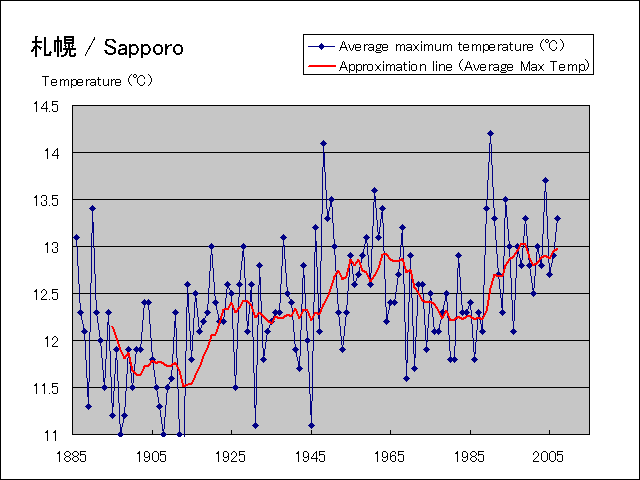
Detailed change graph of mean maximum temperature of Sapporo.(It is moving average data for ten years from 1886 to 2007.)
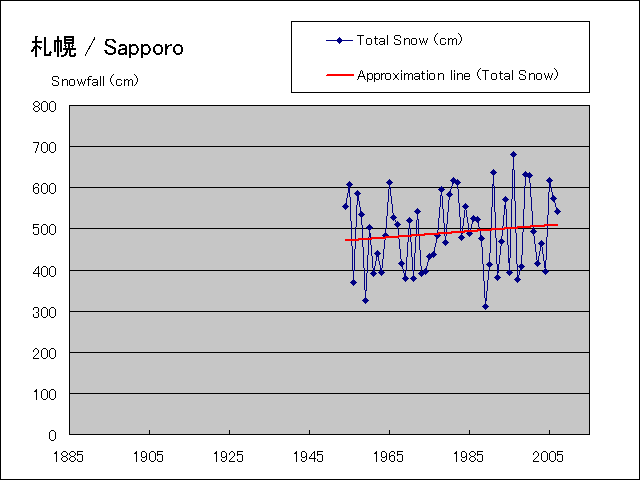
Change graph of snowfall during year of Sapporo(Data from 1954 to 2007)
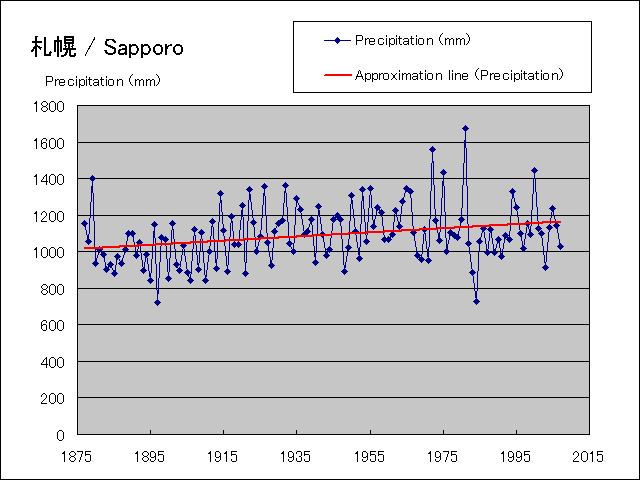
Change graph of annual rainfall of Sapporo(Data from 1887 to 2007)