The majority in Tokyo and the Kanto region are the Pacific Ocean side climates. The weather becomes a thunderstorm in the cycle change due to the cold in spring. It is covered with the seasonal rain front and the weather from which it rains easily continues to the rainy season. Heavy rain gets off easily in the latter half though weak rain is a center in the first half. There is an age of the dry rainy season, too. The day when it clears up because it is covered with Pacific anticyclone and it becomes hot continues in summer. The influence and the thunderstorm of the typhoon happen easily, too. There is year that becomes the weather to which cloudy weather and rain remain unsettled because of the Okhotsk high atmospheric pressure, too. The latter half comes to rain easily because of the autumnal rain front though it clears up because the first half is covered with Pacific anticyclone and a hot day continues in autumn. There are a lot of days when it clears up and air dries in winter. It becomes easy to pass the south coast low-pressure, and the heavy snow from the middle of February to about the beginning of April in various parts of Kanto. The influence comes out in transportation when becoming a heavy snow. The highest recorded temperature was 39.5 °C on July 20, 2004, while the lowest recorded temperature was -9.2 °C on January 13, 1876.
Tokyo Temperature and Precipitation Graph
Japan Map(Google Map)
Now, Map data loading ..... (If the map is not displayed, There is a possibility to be able to display by permitting JavaScript.)
Tokyo (東京) Temperature & Precipitation Monthly Averages
Temperature scale: degree Celsius (°C)
Month
Jan
Feb
Mar
Apr
May
Jun
Jul
Aug
Sep
Oct
Nov
Dec
Average High Temperature (°C)
9.8
10
12.9
18.4
22.7
25.2
29
30.8
26.8
21.6
16.7
12.3
Average Low Temperature (°C)
2.1
2.4
5.1
10.5
15.1
18.9
22.5
24.2
20.7
15
9.5
4.6
Average Precipitation (mm)
48.6
60.2
114.5
130.3
128
164.9
161.5
155.1
208.5
163.1
92.5
39.6
Rainy Days
4.6
5.8
9.5
10.1
9.6
11.9
10.4
8.2
11.3
9.1
6.2
3.8
Tokyo's Year Average Temperature 16.1 °C, Year Average High Temperature 19.7 °C, Year Average Low Temperature 12.6 °C, The average annual rainfall 1466.8 mm
Tokyo's Year Average Temperature 61 °F, Year Average High Temperature 67.4 °F, Year Average Low Temperature 54.6 °F, The average annual rainfall 57.7 inches
Osaka (大阪市) Temperature & Precipitation Monthly Averages
Month
Jan
Feb
Mar
Apr
May
Jun
Jul
Aug
Sep
Oct
Nov
Dec
Average High Temperature (°C)
9.3
9.6
13.3
19.6
24.2
27.4
31.4
33
28.7
23
17.3
12
Average Low Temperature (°C)
2.5
2.5
5.2
10.5
15.2
19.8
24
25.1
21.1
15
9.5
4.7
Average Precipitation (mm)
43.7
58.7
99.5
121.1
139.6
201
155.4
99
174.9
109.3
66.3
37.7
Rainy Days
5.3
6.1
9.3
10.1
9.7
11.6
9.6
7.2
10.4
7.9
6.4
5.2
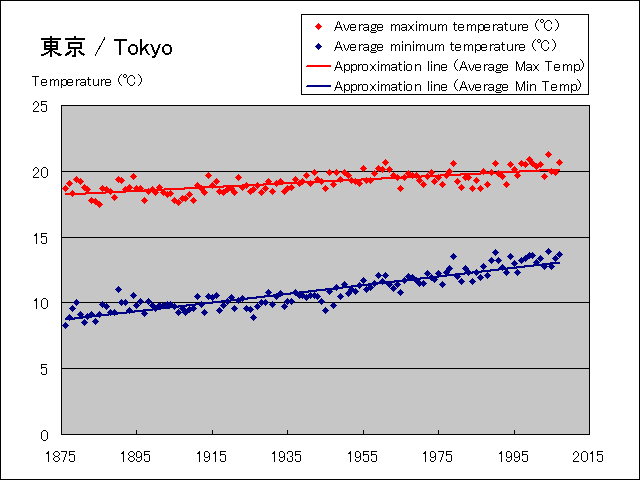
Rising graph of mean maximum temperature and mean minimum temperature of Tokyo by global warming.(Data from 1876 to 2007)
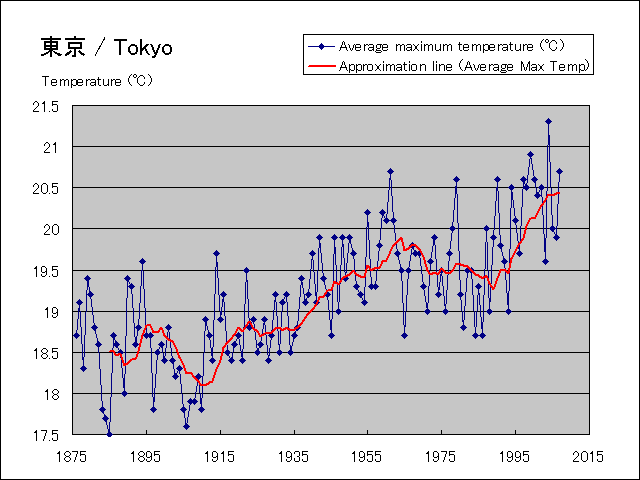
Detailed change graph of mean maximum temperature of Tokyo.(It is moving average data for ten years from 1876 to 2007.)
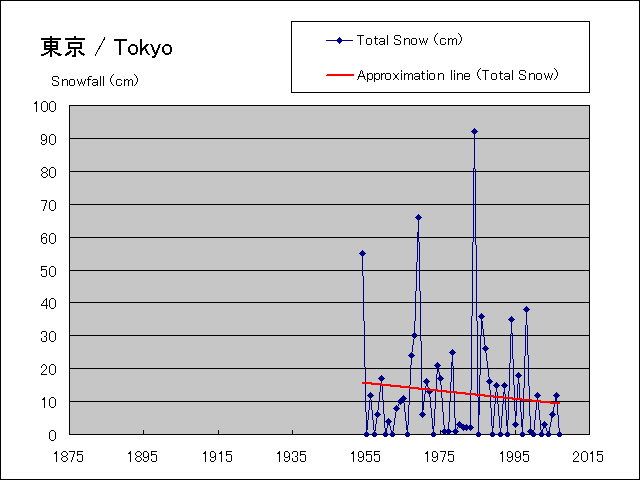
Change graph of snowfall during year of Tokyo(Data from 1954 to 2007)
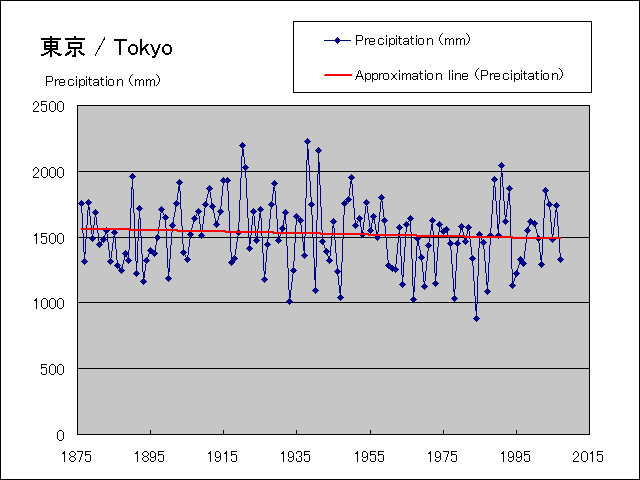
Change graph of annual rainfall of Tokyo(Data from 1876 to 2007)